Business Dashboard
MOVEPOINT LOGISTICS DASHBOARD
1. PROJECT OVERVIEW
The Movepoint Logistics Dashboard delivers comprehensive fleet and driver management capabilities for transportation companies, enabling operations managers to monitor driver performance, track vehicle utilization, and optimize delivery operations. Designed for logistics coordinators, fleet managers, and operations directors, this multi-view dashboard answers critical business questions: Which drivers are most efficient and reliable? How are vehicles performing across different routes? What are delivery success rates and driver satisfaction scores? Where are operational bottlenecks occurring? By consolidating driver profiles, vehicle data, and trip-level details into one unified platform, the dashboard eliminates the need for scattered spreadsheets or manual performance tracking across the logistics operation.
2. DATA & REQUIREMENTS
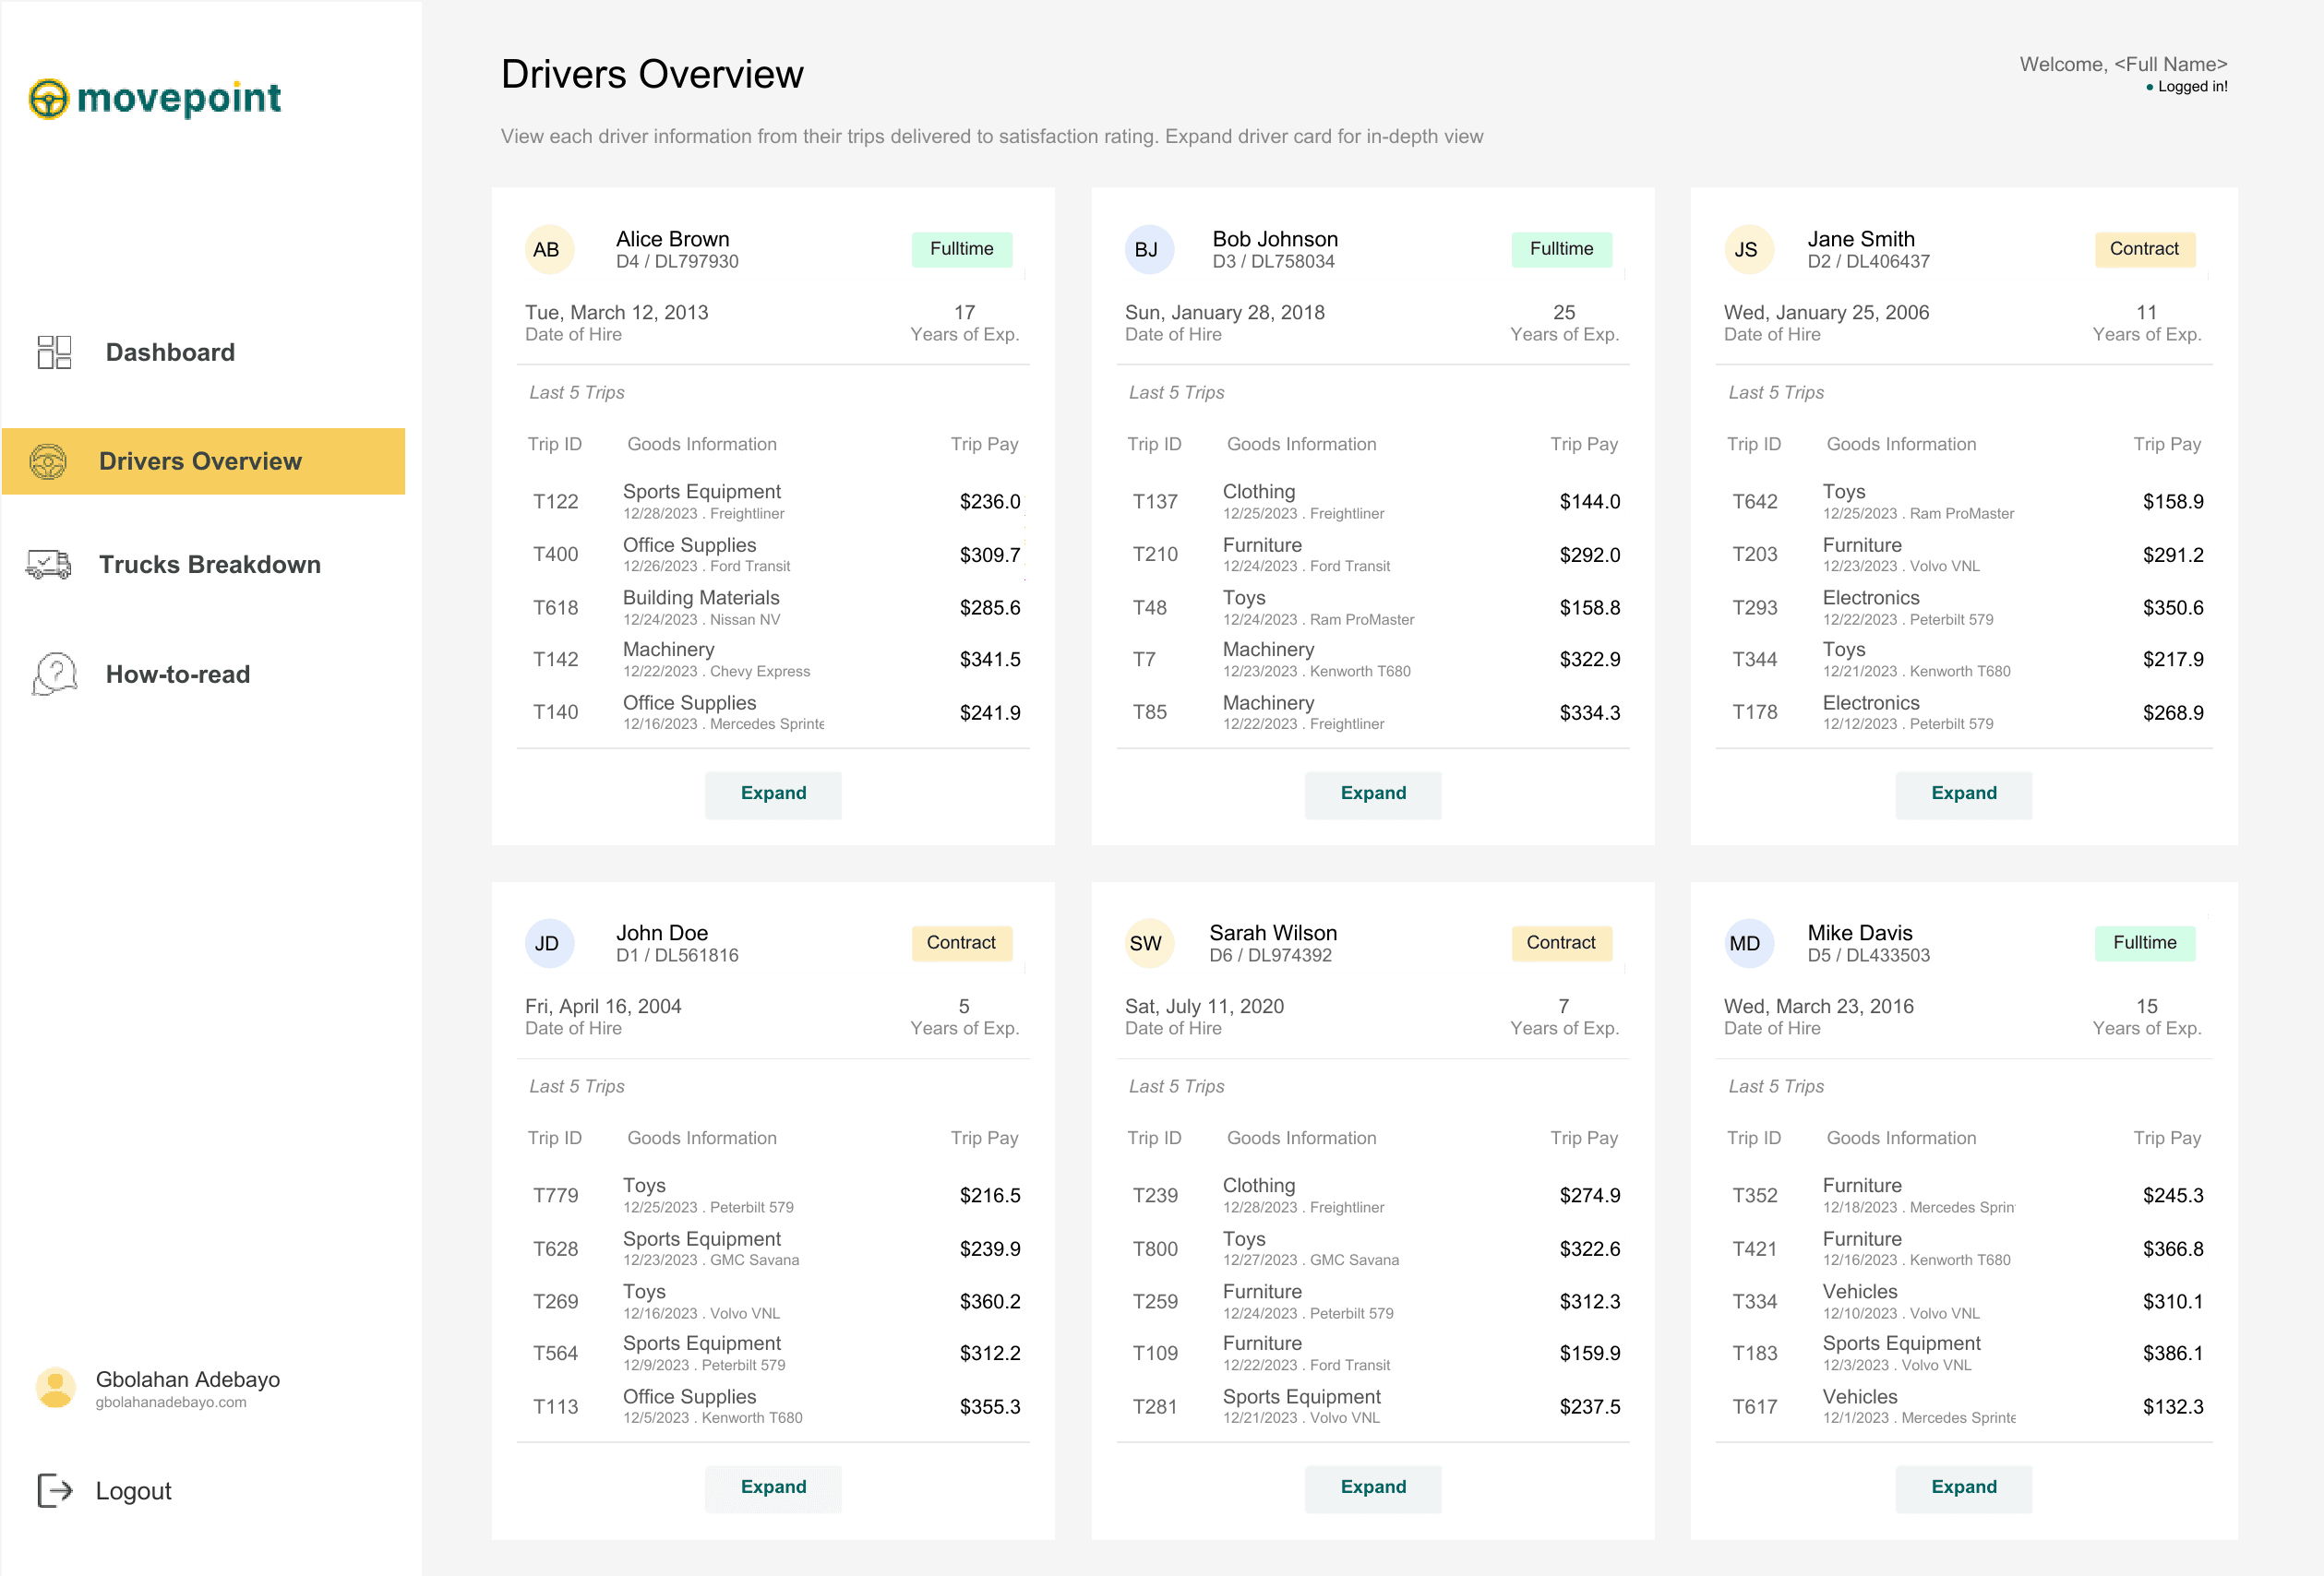
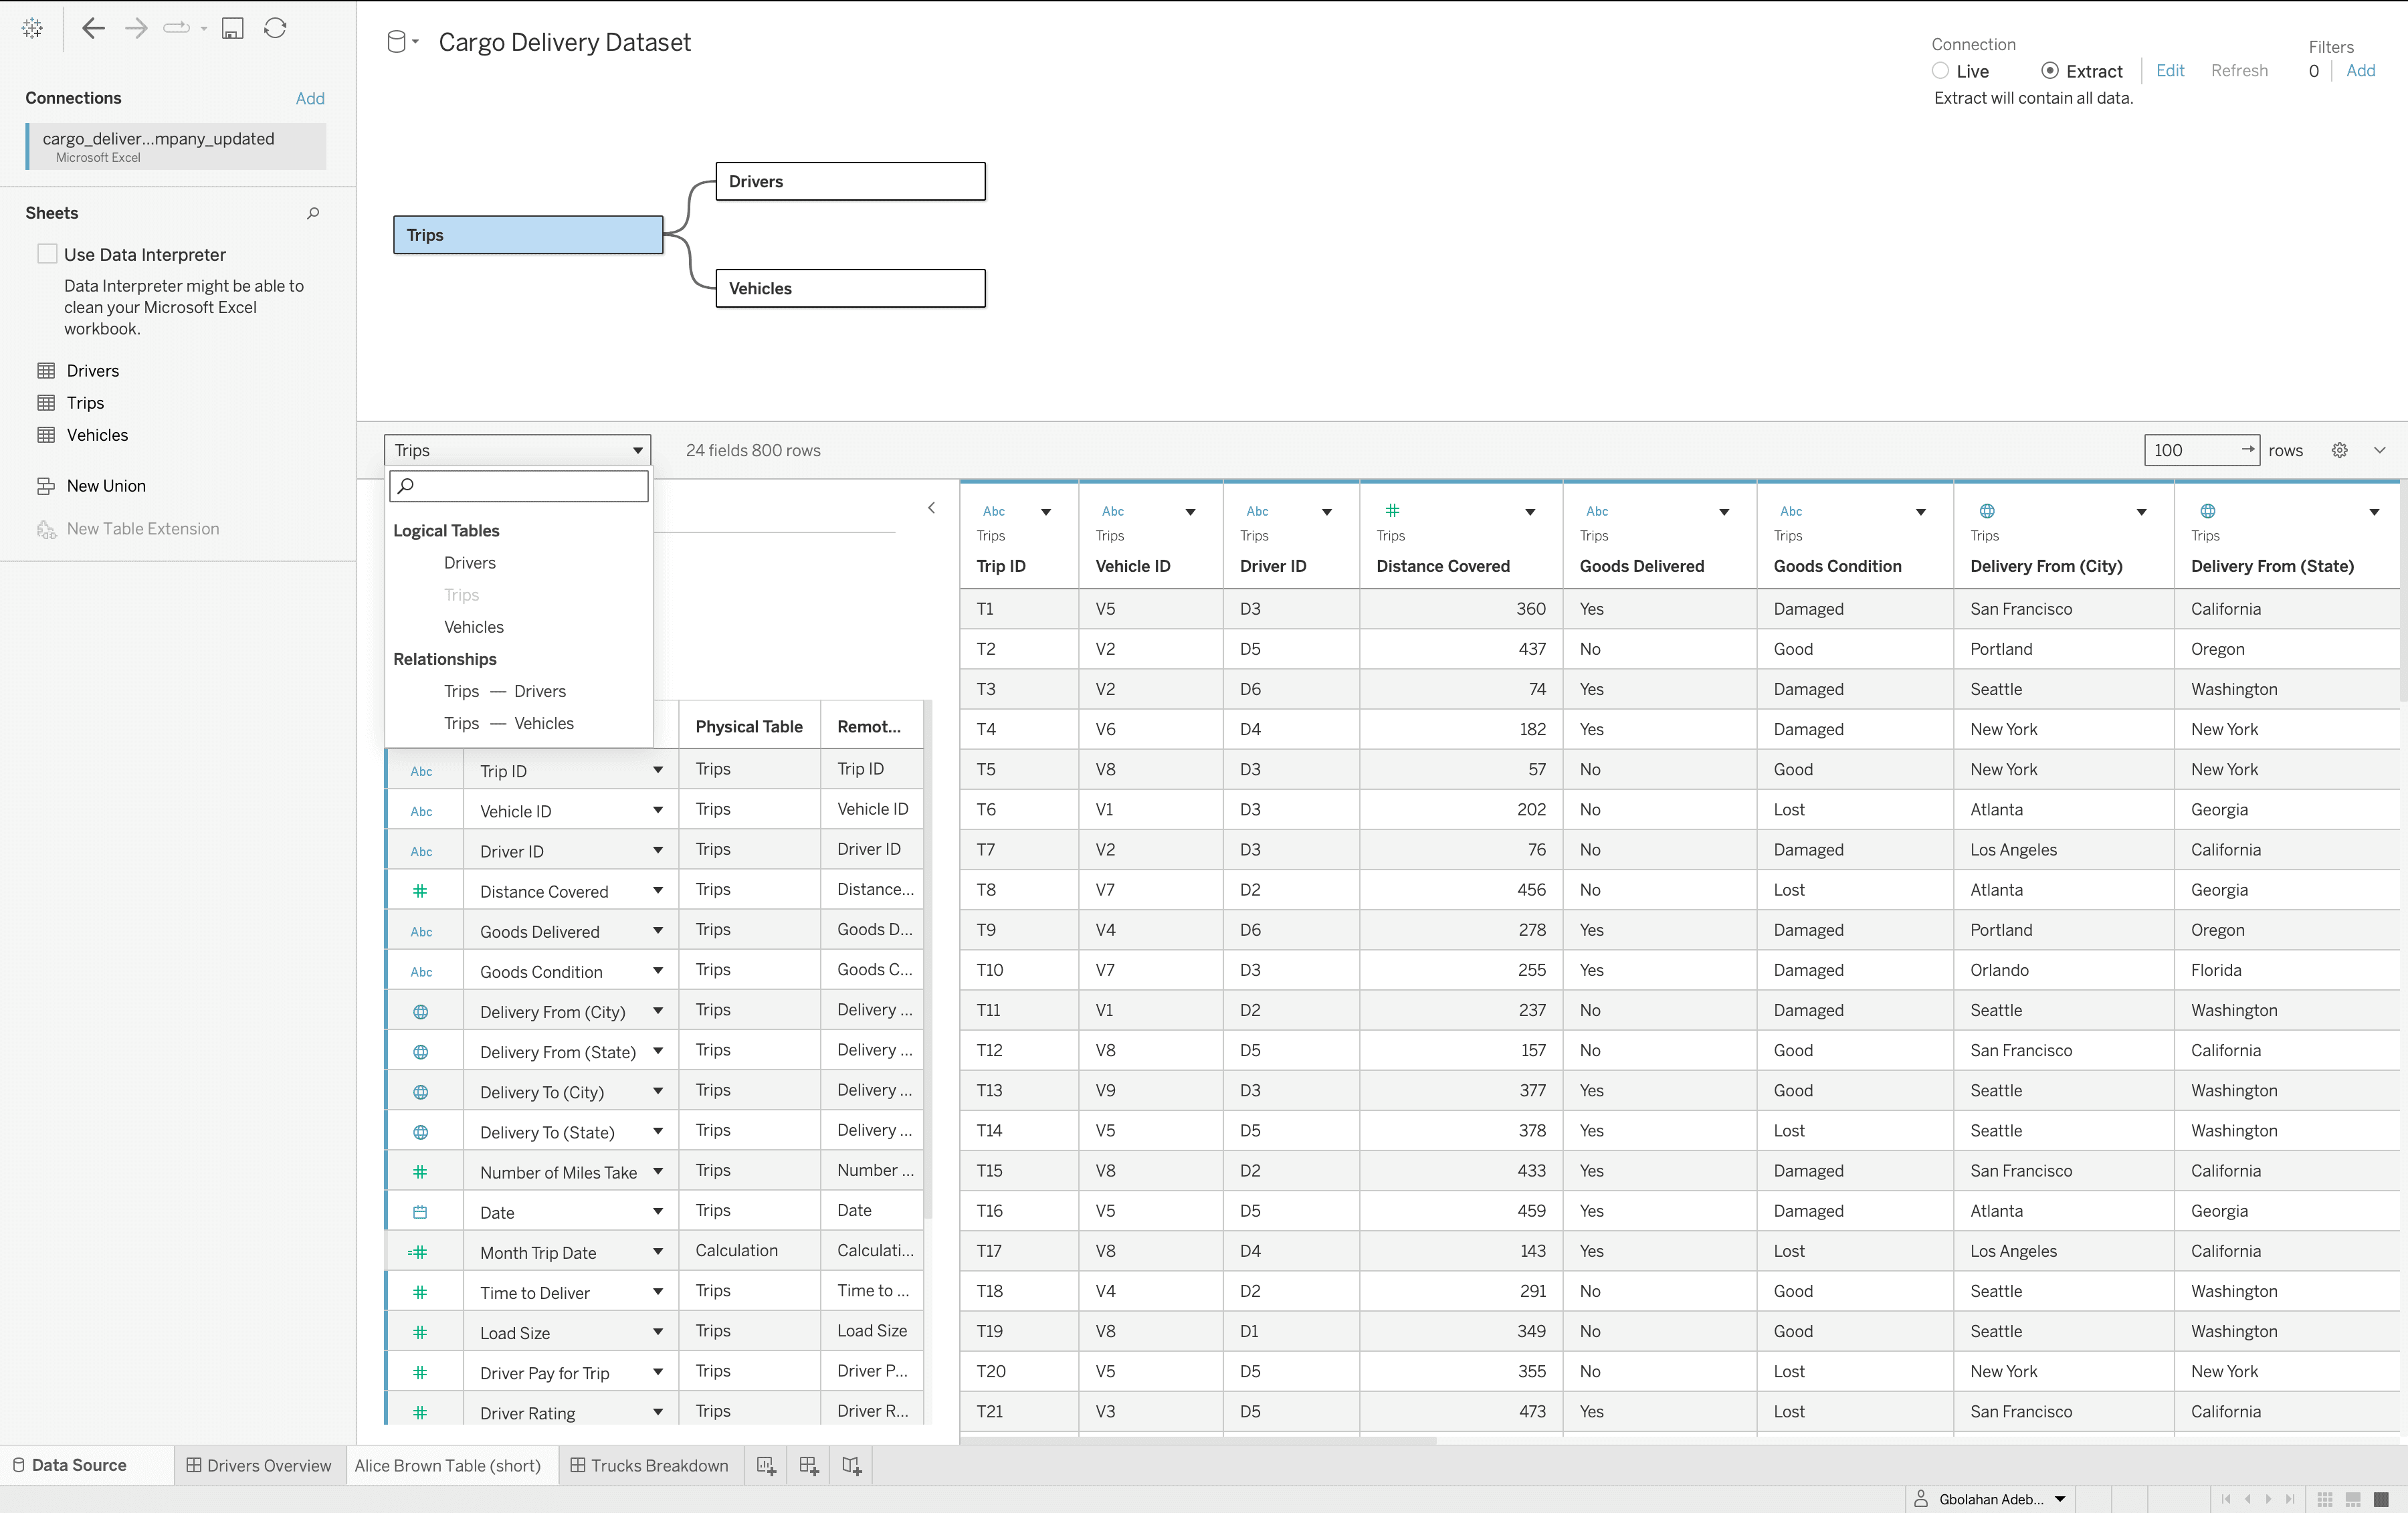
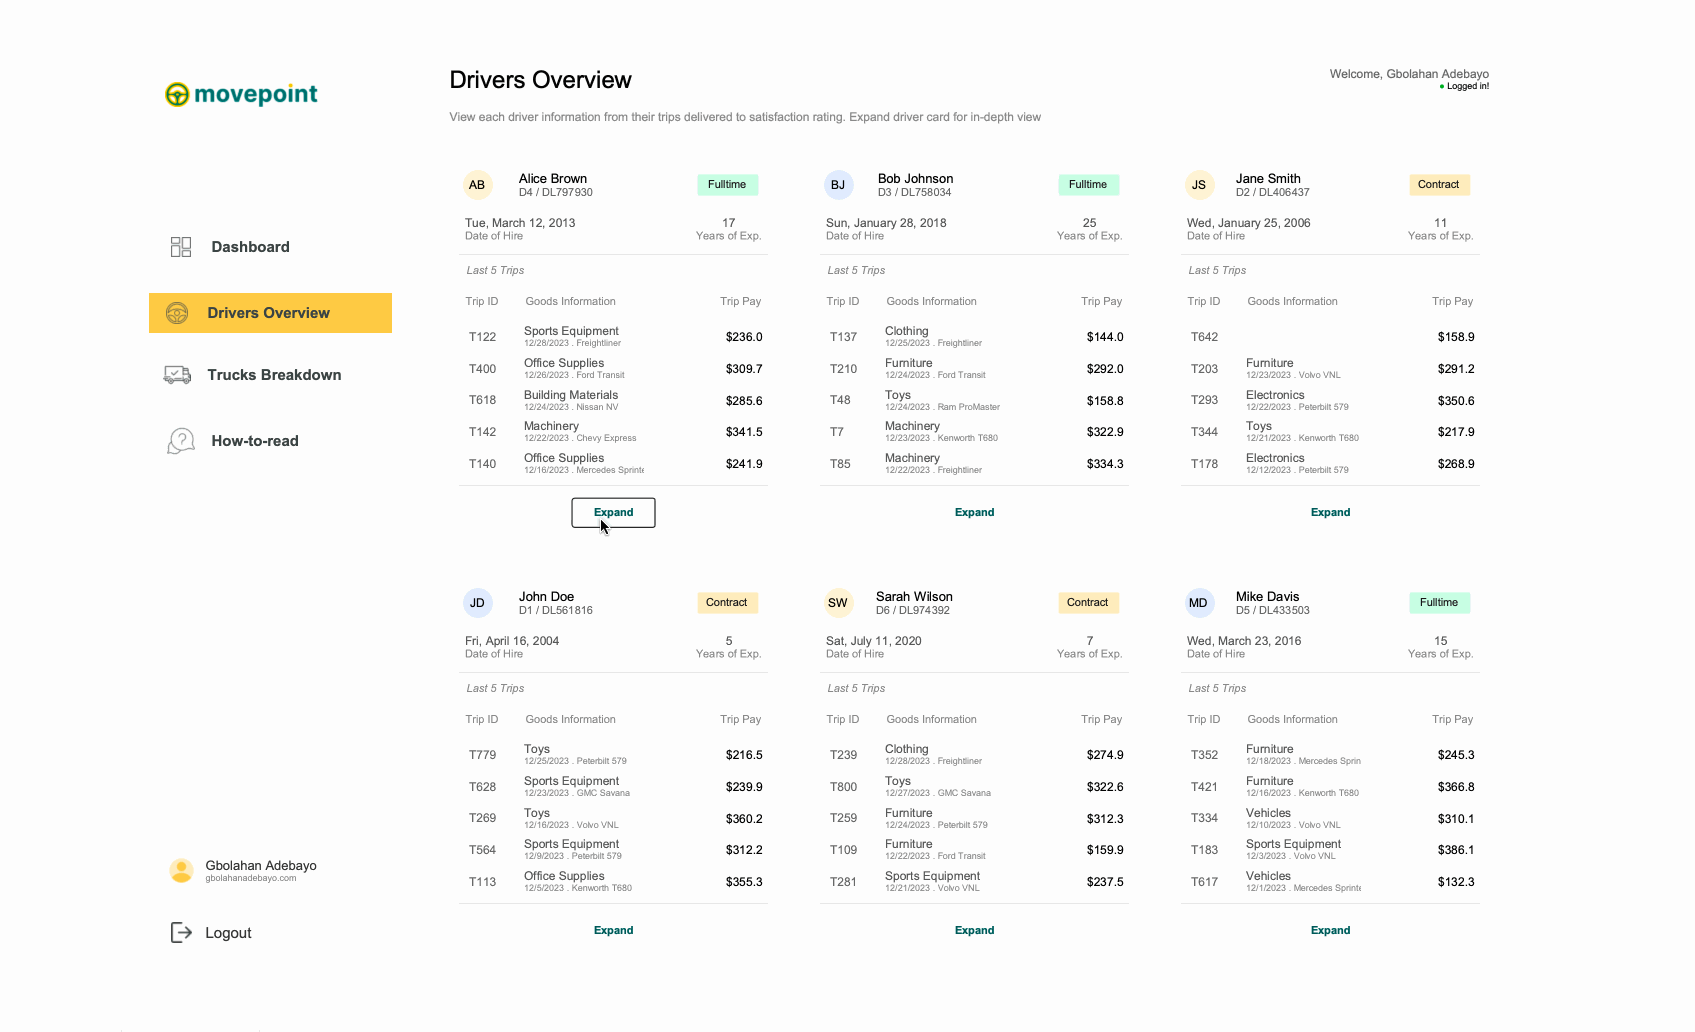
The system tracks complete logistics operations data across six drivers (Alice Brown, Bob Johnson, Jane Smith, John Doe, Sarah Wilson, Mike Davis) and ten vehicles spanning different types (Freightliner, Kenworth T680, Peterbilt 579, Volvo VNL, Ford Transit, Mercedes Sprinter, Ram ProMaster, Chevy Express, Nissan NV, GMC Savana). Driver records include employment details (driver ID, hire date, years of experience), contact information (phone, email), work position status (Fulltime or Contract), performance metrics (delivery counts, average delivery time, satisfaction ratings), and individual trip histories with goods information, delivery locations, vehicle condition reports, and payment amounts. Vehicle data captures specifications (load capacity, maximum speed, type, purchase date, VIN numbers, last maintenance dates), route histories with trip details, and comparative performance metrics. The primary requirement was building a comprehensive logistics command center where managers could evaluate individual driver performance, compare vehicle efficiency, track delivery success rates, and drill down into trip-level details for operational optimization and strategic planning.
3. INTERACTIVE FEATURES
The dashboard operates across three main views accessible through left sidebar navigation. The Drivers Overview displays all six drivers as expandable profile cards showing initials, driver IDs, employment status badges (Fulltime or Contract), hire dates, years of experience, and their last five trips with goods information and trip pay. Each card has an "Expand" button for detailed analysis. Clicking any driver opens a comprehensive detail modal showing month-by-month navigation buttons (J, F, M, A, M, J, J, A, S, O, N, D), four key performance metrics (number of deliveries with percentage comparisons and rankings, total pay for trips with rankings, average delivery time with percentage improvements, average satisfaction rating with rankings), and a detailed trip table displaying trip/vehicle ID, delivery dates, delivery locations with routes, vehicle condition status (Lost, Damaged, Good), delivery completion status, delivery times with visual bars, and driver pay amounts. The Vehicles Breakdown view presents a filterable list of all ten cargo vehicles with model names, VINs, types, and purchase years. Selecting any vehicle displays a detailed panel showing vehicle specifications (load capacity, maximum speed, type, maintenance dates, purchase information), routes history listing recent trips with dates, goods transported, and delivery locations, and a vehicle comparison section with toggle buttons (All, Truck, Van) showing how the selected vehicle ranks against fleet peers by total deliveries using horizontal bar charts. Month navigation buttons enable temporal filtering across all views.
4. TECHNICAL EXECUTION & OUTCOME
Built in Tableau Desktop with custom UI design matching the Movepoint brand identity, the dashboard leverages parameter actions for view switching and modal popups, calculated fields for percentage comparisons and performance rankings, and LOD calculations for driver and vehicle aggregations. The color-coded system uses green for fulltime employees and yellow for contract workers, condition-based colors for vehicle status (green for good, orange for damaged, red for lost), and visual bars for delivery time comparisons enabling instant pattern recognition. The technical architecture supports coordinated filtering across driver, vehicle, and trip dimensions while maintaining data consistency. Clean card-based layouts with expandable sections prevent information overload while providing drill-down access to granular details. The result is a comprehensive logistics operations platform that enables fleet managers to identify top-performing drivers for recognition and retention, operations teams to track vehicle utilization and maintenance needs, dispatch coordinators to optimize route assignments based on driver experience and vehicle capabilities, and executives to monitor overall fleet efficiency metrics. This self-service analytics tool eliminates hours of manual reporting, transforms scattered logistics data into unified strategic insights, and supports data-driven decisions for improving delivery success rates, optimizing driver assignments, and reducing operational costs across the transportation operation.
More Projects


Business Dashboard
MOVEPOINT LOGISTICS DASHBOARD
1. PROJECT OVERVIEW
The Movepoint Logistics Dashboard delivers comprehensive fleet and driver management capabilities for transportation companies, enabling operations managers to monitor driver performance, track vehicle utilization, and optimize delivery operations. Designed for logistics coordinators, fleet managers, and operations directors, this multi-view dashboard answers critical business questions: Which drivers are most efficient and reliable? How are vehicles performing across different routes? What are delivery success rates and driver satisfaction scores? Where are operational bottlenecks occurring? By consolidating driver profiles, vehicle data, and trip-level details into one unified platform, the dashboard eliminates the need for scattered spreadsheets or manual performance tracking across the logistics operation.
2. DATA & REQUIREMENTS
The system tracks complete logistics operations data across six drivers (Alice Brown, Bob Johnson, Jane Smith, John Doe, Sarah Wilson, Mike Davis) and ten vehicles spanning different types (Freightliner, Kenworth T680, Peterbilt 579, Volvo VNL, Ford Transit, Mercedes Sprinter, Ram ProMaster, Chevy Express, Nissan NV, GMC Savana). Driver records include employment details (driver ID, hire date, years of experience), contact information (phone, email), work position status (Fulltime or Contract), performance metrics (delivery counts, average delivery time, satisfaction ratings), and individual trip histories with goods information, delivery locations, vehicle condition reports, and payment amounts. Vehicle data captures specifications (load capacity, maximum speed, type, purchase date, VIN numbers, last maintenance dates), route histories with trip details, and comparative performance metrics. The primary requirement was building a comprehensive logistics command center where managers could evaluate individual driver performance, compare vehicle efficiency, track delivery success rates, and drill down into trip-level details for operational optimization and strategic planning.
3. INTERACTIVE FEATURES
The dashboard operates across three main views accessible through left sidebar navigation. The Drivers Overview displays all six drivers as expandable profile cards showing initials, driver IDs, employment status badges (Fulltime or Contract), hire dates, years of experience, and their last five trips with goods information and trip pay. Each card has an "Expand" button for detailed analysis. Clicking any driver opens a comprehensive detail modal showing month-by-month navigation buttons (J, F, M, A, M, J, J, A, S, O, N, D), four key performance metrics (number of deliveries with percentage comparisons and rankings, total pay for trips with rankings, average delivery time with percentage improvements, average satisfaction rating with rankings), and a detailed trip table displaying trip/vehicle ID, delivery dates, delivery locations with routes, vehicle condition status (Lost, Damaged, Good), delivery completion status, delivery times with visual bars, and driver pay amounts. The Vehicles Breakdown view presents a filterable list of all ten cargo vehicles with model names, VINs, types, and purchase years. Selecting any vehicle displays a detailed panel showing vehicle specifications (load capacity, maximum speed, type, maintenance dates, purchase information), routes history listing recent trips with dates, goods transported, and delivery locations, and a vehicle comparison section with toggle buttons (All, Truck, Van) showing how the selected vehicle ranks against fleet peers by total deliveries using horizontal bar charts. Month navigation buttons enable temporal filtering across all views.
4. TECHNICAL EXECUTION & OUTCOME
Built in Tableau Desktop with custom UI design matching the Movepoint brand identity, the dashboard leverages parameter actions for view switching and modal popups, calculated fields for percentage comparisons and performance rankings, and LOD calculations for driver and vehicle aggregations. The color-coded system uses green for fulltime employees and yellow for contract workers, condition-based colors for vehicle status (green for good, orange for damaged, red for lost), and visual bars for delivery time comparisons enabling instant pattern recognition. The technical architecture supports coordinated filtering across driver, vehicle, and trip dimensions while maintaining data consistency. Clean card-based layouts with expandable sections prevent information overload while providing drill-down access to granular details. The result is a comprehensive logistics operations platform that enables fleet managers to identify top-performing drivers for recognition and retention, operations teams to track vehicle utilization and maintenance needs, dispatch coordinators to optimize route assignments based on driver experience and vehicle capabilities, and executives to monitor overall fleet efficiency metrics. This self-service analytics tool eliminates hours of manual reporting, transforms scattered logistics data into unified strategic insights, and supports data-driven decisions for improving delivery success rates, optimizing driver assignments, and reducing operational costs across the transportation operation.
More Projects
Business Dashboard
MOVEPOINT LOGISTICS DASHBOARD
1. PROJECT OVERVIEW
The Movepoint Logistics Dashboard delivers comprehensive fleet and driver management capabilities for transportation companies, enabling operations managers to monitor driver performance, track vehicle utilization, and optimize delivery operations. Designed for logistics coordinators, fleet managers, and operations directors, this multi-view dashboard answers critical business questions: Which drivers are most efficient and reliable? How are vehicles performing across different routes? What are delivery success rates and driver satisfaction scores? Where are operational bottlenecks occurring? By consolidating driver profiles, vehicle data, and trip-level details into one unified platform, the dashboard eliminates the need for scattered spreadsheets or manual performance tracking across the logistics operation.
2. DATA & REQUIREMENTS
The system tracks complete logistics operations data across six drivers (Alice Brown, Bob Johnson, Jane Smith, John Doe, Sarah Wilson, Mike Davis) and ten vehicles spanning different types (Freightliner, Kenworth T680, Peterbilt 579, Volvo VNL, Ford Transit, Mercedes Sprinter, Ram ProMaster, Chevy Express, Nissan NV, GMC Savana). Driver records include employment details (driver ID, hire date, years of experience), contact information (phone, email), work position status (Fulltime or Contract), performance metrics (delivery counts, average delivery time, satisfaction ratings), and individual trip histories with goods information, delivery locations, vehicle condition reports, and payment amounts. Vehicle data captures specifications (load capacity, maximum speed, type, purchase date, VIN numbers, last maintenance dates), route histories with trip details, and comparative performance metrics. The primary requirement was building a comprehensive logistics command center where managers could evaluate individual driver performance, compare vehicle efficiency, track delivery success rates, and drill down into trip-level details for operational optimization and strategic planning.
3. INTERACTIVE FEATURES
The dashboard operates across three main views accessible through left sidebar navigation. The Drivers Overview displays all six drivers as expandable profile cards showing initials, driver IDs, employment status badges (Fulltime or Contract), hire dates, years of experience, and their last five trips with goods information and trip pay. Each card has an "Expand" button for detailed analysis. Clicking any driver opens a comprehensive detail modal showing month-by-month navigation buttons (J, F, M, A, M, J, J, A, S, O, N, D), four key performance metrics (number of deliveries with percentage comparisons and rankings, total pay for trips with rankings, average delivery time with percentage improvements, average satisfaction rating with rankings), and a detailed trip table displaying trip/vehicle ID, delivery dates, delivery locations with routes, vehicle condition status (Lost, Damaged, Good), delivery completion status, delivery times with visual bars, and driver pay amounts. The Vehicles Breakdown view presents a filterable list of all ten cargo vehicles with model names, VINs, types, and purchase years. Selecting any vehicle displays a detailed panel showing vehicle specifications (load capacity, maximum speed, type, maintenance dates, purchase information), routes history listing recent trips with dates, goods transported, and delivery locations, and a vehicle comparison section with toggle buttons (All, Truck, Van) showing how the selected vehicle ranks against fleet peers by total deliveries using horizontal bar charts. Month navigation buttons enable temporal filtering across all views.
4. TECHNICAL EXECUTION & OUTCOME
Built in Tableau Desktop with custom UI design matching the Movepoint brand identity, the dashboard leverages parameter actions for view switching and modal popups, calculated fields for percentage comparisons and performance rankings, and LOD calculations for driver and vehicle aggregations. The color-coded system uses green for fulltime employees and yellow for contract workers, condition-based colors for vehicle status (green for good, orange for damaged, red for lost), and visual bars for delivery time comparisons enabling instant pattern recognition. The technical architecture supports coordinated filtering across driver, vehicle, and trip dimensions while maintaining data consistency. Clean card-based layouts with expandable sections prevent information overload while providing drill-down access to granular details. The result is a comprehensive logistics operations platform that enables fleet managers to identify top-performing drivers for recognition and retention, operations teams to track vehicle utilization and maintenance needs, dispatch coordinators to optimize route assignments based on driver experience and vehicle capabilities, and executives to monitor overall fleet efficiency metrics. This self-service analytics tool eliminates hours of manual reporting, transforms scattered logistics data into unified strategic insights, and supports data-driven decisions for improving delivery success rates, optimizing driver assignments, and reducing operational costs across the transportation operation.